On this site, I’m publishing the data I have collected during my experiments and tests with mostly LiFePO4 cells. I use the ZKE-Tech EBC-A20 and ZKE-Tech EBC-A40L tester for that. Links to both devices can be found here.
If you don’t have any of these testers but you still would like to analise the data, you can simply download the ZKE software and install it on your Windows PC. All csv files below can then easily be imported into the software for further study and exploration.
The download for the software is here (without actual tester, you only need to download the eb_setup_v1.8.5en_1001.exe file and the manual if needed).
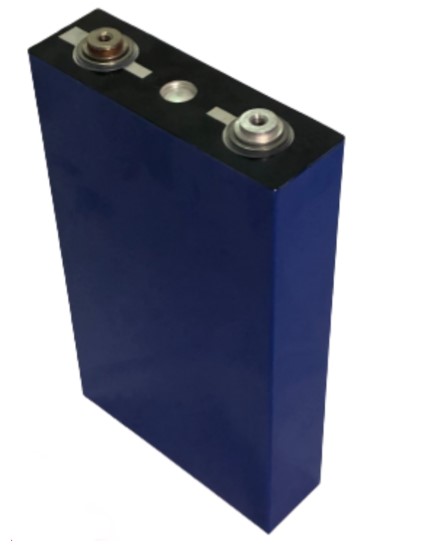
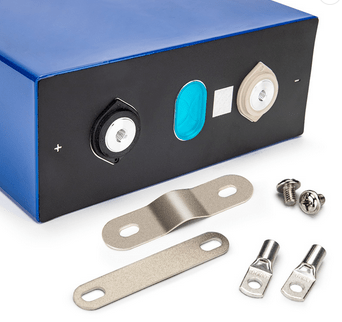
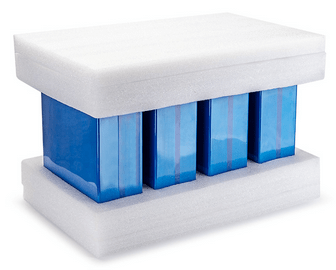
Ubetter LiFePO4 Cell, 3.2V 100Ah
Product link
Datasheet (PDF)
Test 1:
Full Charge/Discharge
Charge: 5A (0.05C) to 3.65V
Discharge: 20A (0.2C) to 2.5V
Temperature: 21°C
Tester: ZKE-Tech EBC-A20
Charge and discharge graphs
Full charge and discharge curve data
Download Data (pdf and csv files)
Full video and analysis
Test 2:
Capacity Test with different SOC
Charge to 3.5V with and without absorption.
Charge to 3.4V with and without absorption
Measure achieved capacity by discharging to 2.5V for all 4 tests
Charge and discharge: 20A (0.2C)
Temperature: 20-24°C
Tester: ZKE-Tech EBC-A40L
Test 2.1: CV Charge 3.5V/20A, CC Discharge 2.5V/20A, no absorption
Capacity charged: 108.06Ah
Energy charged: 360.41Wh
Capacity discharged: 107.28Ah
Energy discharged: 345.13Wh
Test 2.2: CV Charge 3.5V/20A, CC Discharge 2.5V/20A, with absorption to 0.1A
Capacity charged: 110.34Ah
Energy charged: 372.11Wh
Capacity discharged: 109.17Ah
Energy discharged: 350.32Wh
Test 2.3: CV Charge 3.4V/20A, CC Discharge 2.5V/20A, no absorption
Capacity charged:
Energy charged:
Capacity discharged: 95.74Ah
Energy discharged: 308.19Wh
Test 2.4: CV Charge 3.4V/20A, CC Discharge 2.5V/20A, with absorption to 0.1A
Capacity charged:
Energy charged:
Capacity discharged: 109.32Ah
Energy discharged: 352.05Wh
Download Data (bmp and csv files)
Full video and analysis
Test 3:
CV charge from 2.5V to 3.35V with full absorption.
Charge current: 20A
Temperature: 20°C
Will the cell stop charging at some point or continue taking energy and eventually overcharge?
Tester: ZKE-Tech EBC-A40L
Charge graph (bmp)
Full charge curve data (.csv)
Download Data
Full video and analysis
Test 4:
Charging and discharging with 30A
Charge curve (bmp)
Full charge and discharge curve data (csv)
Download data
Test 5:
Charging with different currents from 5A to 40A to 3.5V.
Discharging with 20A to 2.8V.
Measuring time, capacity and efficiency of different charging currents.
Tester: ZKE-Tech EBC-A40L
All charge and discharge curves for 5A, 10A, 20A, 30A and 40A (bmp)
Full charge and discharge curves data (csv)
Download Data
Full video and analysis
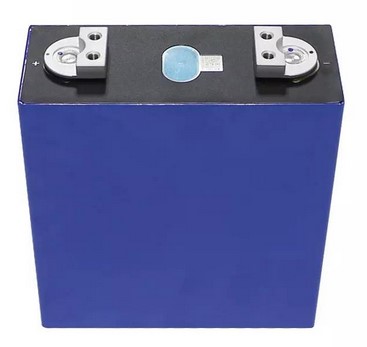
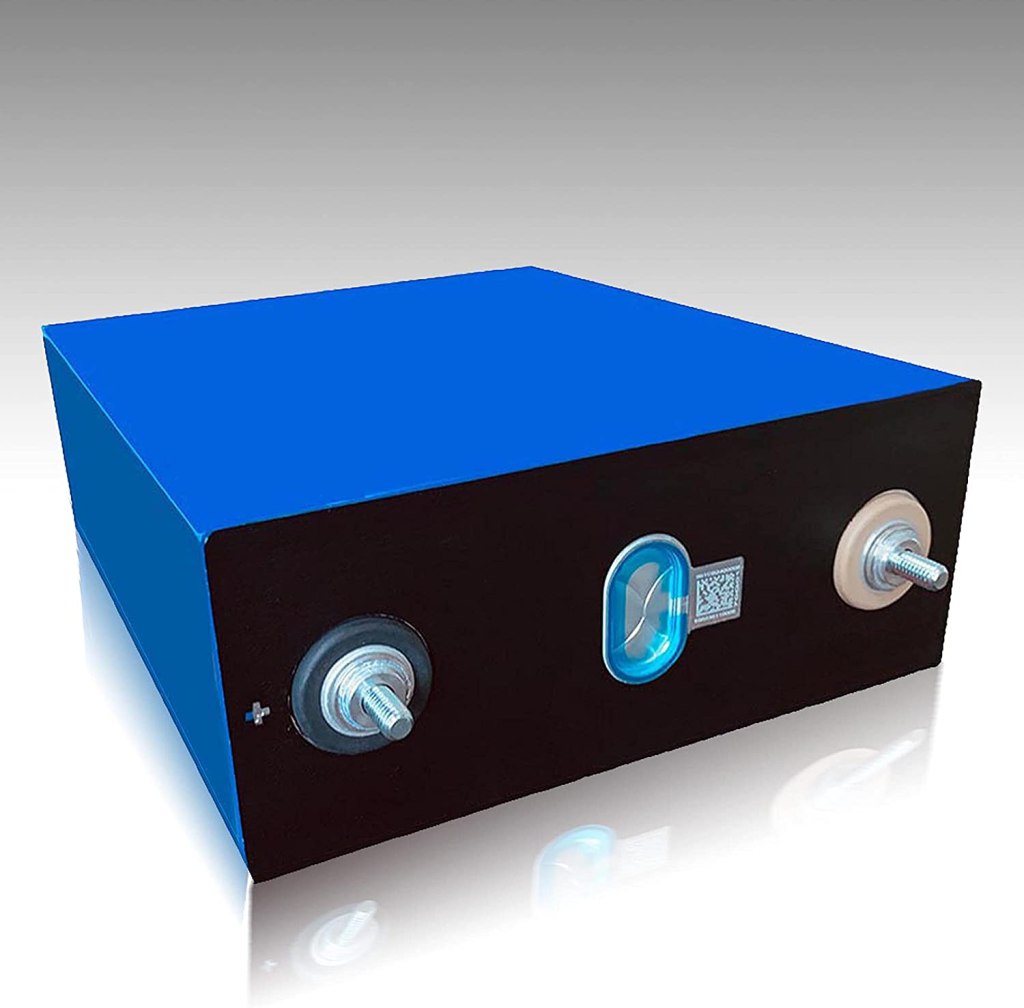
EVE LF280 LiFePO4 Cell, 3.2V 280Ah
Test1:
CV charge to 3.5V with full absorption.
Discharge: CC 40A to 2.9V
Charge: CV 40A to 3.5V
Tester: ZKE-Tech EBC-A40L
Charge/discharge graph (bmp)
Full charge and discharge curve data (.csv)
Download Data
Full video and analysis
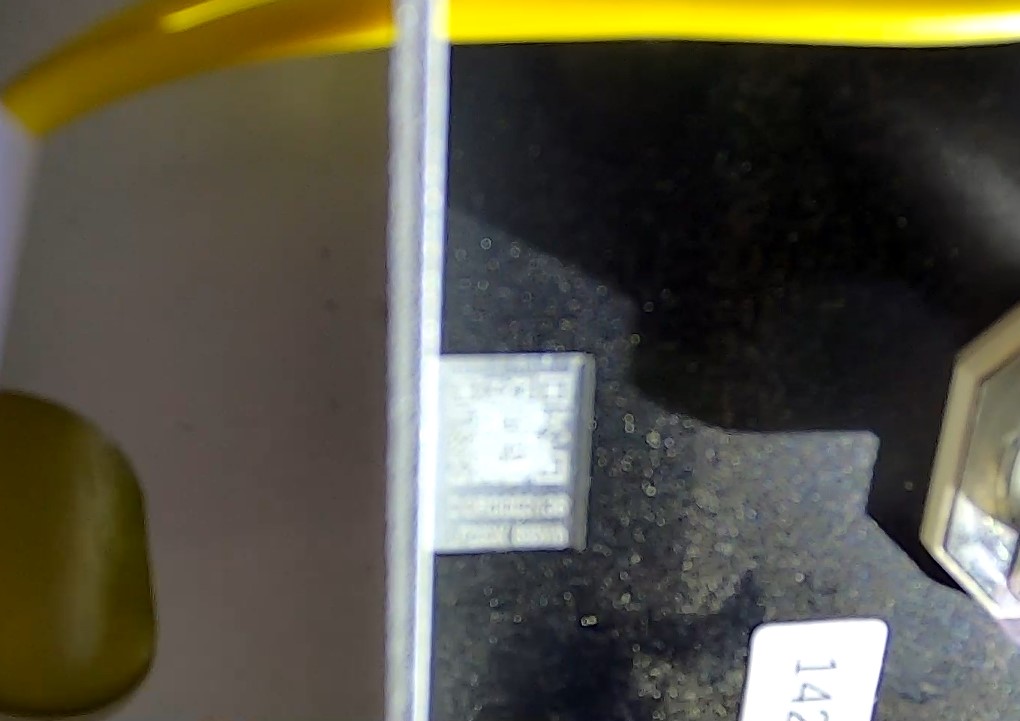
EVE LF280K ‘B’
These cells have a ‘B’ stamped onto the QR code, so are technically B-Grade cells. I have tested these cells in the Gobelpower Battery GP-SR1-PC200
Test1:
CV charging with 40A to 3.65V, 1A cut-off.
CC Discharge with 40A to 2.5V
Tester: ZKE-Tech EBC-A40L
Charge/discharge graph (bmp)
Full charge and discharge curve data (.csv)
Download Data (Google Drive)
Full Video analysis with charge and discharge curves explained.
EVE LF280K, Certified Automotive Grade Cell
Test1:
Full charge/discharge cycle
2-5V-3.65V, 40A, 15.2A cut-off
3.65V-2.5V, 40A
Tester: ZKE-Tech EBC-A40L
Charge/discharge graph (bmp)
Full charge and discharge curve data (.csv)
Download Data (Google Drive)
Full Video review and capacity test with detailed explanation of charge and discharge curve
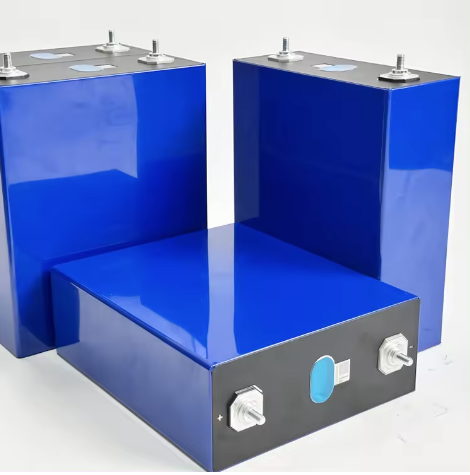
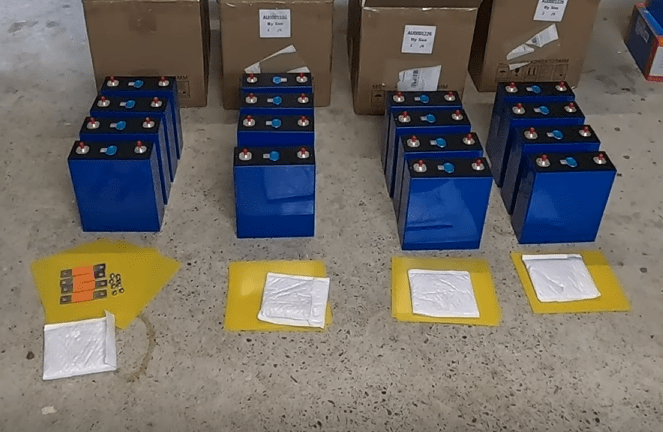
EVE LF304 LiFePO4 Cell, 3.2V 304Ah
Test 1
Capacity test of all 4 cells.
Discharge form 3.65V with CC of 40A to 2.5V.
Compare capacities and spread.
Charge/discharge graph (bmp)
Full charge and discharge curve data (.csv)
Download Data
Full video and analysis
Test2:
Capacity Test Cell #1, discharge from 3.65V to 2.5V, 40A
Repetition of discharge test of cell #1 11.03.2023 (18months later than Test1)
Discharge data and curve (.csv and BMP)
Download Data

EVE LF304 vs. EVE LF304 Certified Automotive Grade Cell
Test1:
Discharge from 3.65V to 2.5V, 40A
Comparing graphs and internal resistance
Capacity and graph comparison of Qishou #1 (09.2021 and 03.2023) and EVE LF304 certified automotive grade cell #1
Comparison graph (bmp)
All 3 discharge curves (.csv)
Download
Video with analysis
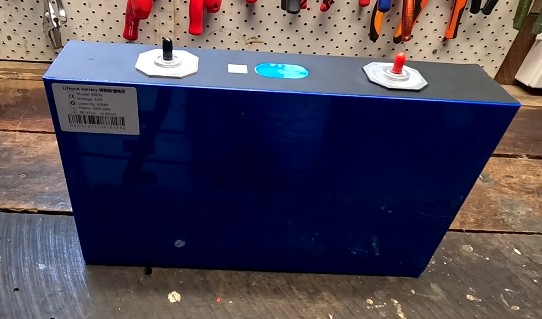
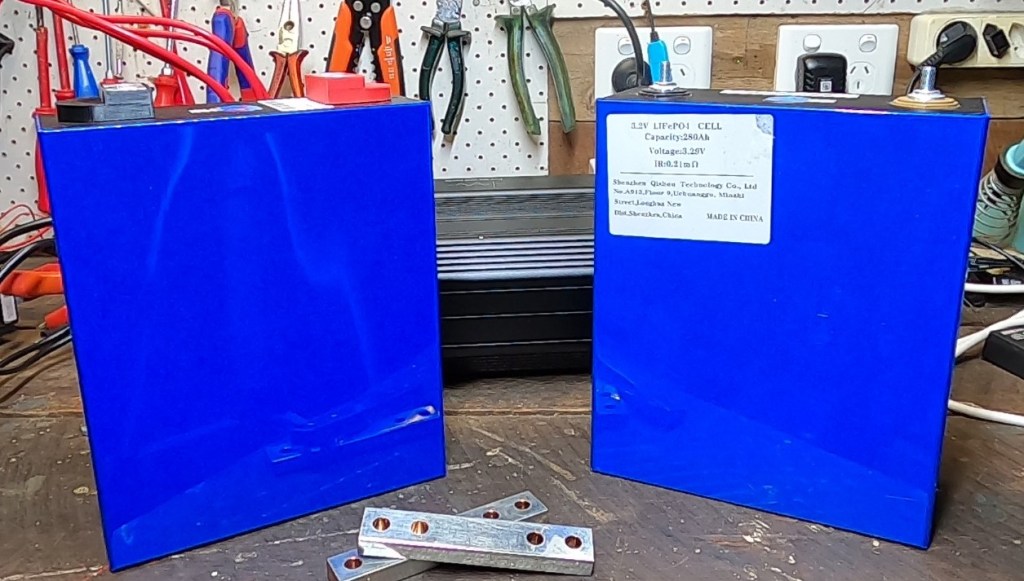
EVE LF304 LiFePO4 cell, 3.2V 304Ah with studs
Test1:
Discharge from 3.65V to 2.5V, 40A
Test2:
Charge from 2.5V to 3.65V, 40A, 1A cut-off
Charge and discharge graph (bmp)
Charge and discharge data (csv)
Comparison of discharge curve:
EVE F280K, B-grade
Hithium 280, B-Grade
Ruipu REPT 280, Certified
EVE LF280K, Certified
Download data
Video review with test results
EVE LF304, B-Grade
– cells provided by EEL
– B stamped on QR code
Test: Fully discharge the cells from 3.65V to 2.5V with 40A.
Tested cell 11 and cell 12 of 16 delivered cells (video).
Discharge curves (bmp)
Discharge data (csv)
of both cells
Download data
EVE MB30 and MB31 Cells
EVE MB30, 3.2V, 306Ah, 10k cycles
EVE MB31, 3.2V, 314Ah, 8k cycles
More info and prices here.
Test1:
CV charging with 40A to 3.65V, 15.3A cut-off.
CC Discharge with 40A to 2.5V
Tester: ZKE-Tech EBC-A40L
EVE MB30 Cell:
Charge and discharge graph (bmp)
Charge and discharge data (csv)
Download data
Test and review video
Test2:
CV charging with 40A to 3.65V, 15.3A cut-off.
CC Discharge with 40A to 2.5V
Tester: ZKE-Tech EBC-A40L
EVE MB31 Cell:
Charge and discharge graph (bmp)
Charge and discharge data (csv)
Download data
Test and review video
EVE MB56
LiFePO4, 3.2V, 628Ah, 2009Wh
Test1: Discharge the cell from 3.65V to 2.5V. Measure capacity and energy.
Charge Curve (.bmp)
Charge Curve Data (.csv)
Download Data
CATL CB530, CBC00, 280
CATL LiFePO4 cells from 280Ah to 530Ah
Watch the comparison video here between CATL and EVE cells.
Test1: CATL CB 530 discharge 3 cells from 3.65V to 2.5V and 40A. Measure their capacity and energy.
Charge the cells from 2.5V to 3.65V and 40A with 0.05C cut-off.
Measure their capacity and energy.
Charge and Discharge Curve (.bmp)
Charge and Discharge Curve Data (.csv)
Overlay of the 3 cells to confirm consistency of capacity and performance.
Download Data
Test2: CATL CBC00 314Ah discharge the cell from 3.65V to 2.5V and 40A. Measure capacity and energy.
Charge the cell from 2.5V to 3.65V and 40A with 0.05C cut-off.
Measure capacity and energy
Charge and Discharge Curve (.bmp)
Charge and Discharge Curve Data (.csv)
Download Data
Test3: CATL 280Ah discharge the cell from 3.65V to 2.5V and 40A. Measure capacity and energy.
Charge the cell from 2.5V to 3.65V and 40A with 0.05C cut-off.
Measure capacity and energy
Charge and Discharge Curve (.bmp)
Charge and Discharge Curve Data (.csv)
Download Data
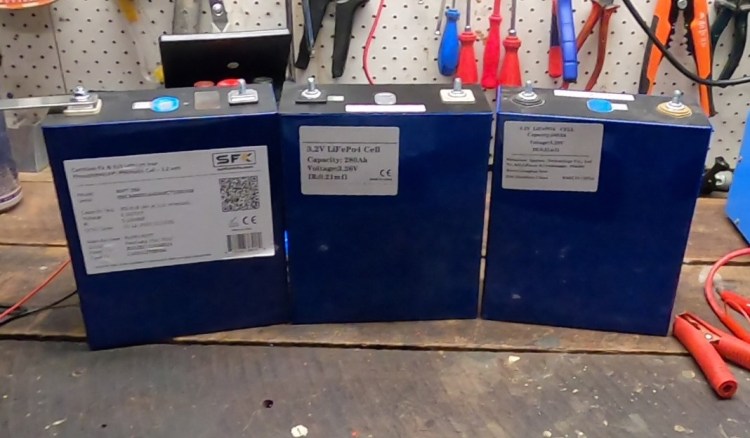
3 Cell Comparison
– Rept 280, certified automotive grade
– 10.000 cycle 280Ah battery, storage grade
– EVE LF 280K, storage grade
Test1: Fully charge cell and measure internal resistance
Rept 280: 0.2mΩ
10k 280: 0.21mΩ
EVE LF 280K: 0.2mΩ
Test2: Fully discharge the cells from 3.65V to 2.5V with 40A. Overlay the discharge curves
Discharge curves (bmp)
Discharge data (csv)
of all 3 cells
Overlay curve (bmp)
Download Data
Test3: Fully charge the cells from 2.5V to 3.65V with 40A. with 1A cut-off. Overlay the Curves
Charge curves (bmp)
Charge data (csv)
of all 3 cells
Overlay curve (bmp)
Download data
Full Video and analysis.
200A+ High Power Discharge Test
EVE LF280K vs fake Hithium 280Ah
Test1:
Discharge 4S battery with 200A from 3.65V to 2.5V, measure the voltage curve and capacity
Discharge curve (bmp) and data (csv) for fake Hithium cells
Discharge curve (bmp) and data (csv) for fake EVE LF280K certified cells
Comparison of both discharge curves (bmp)
Download data
Test video here.
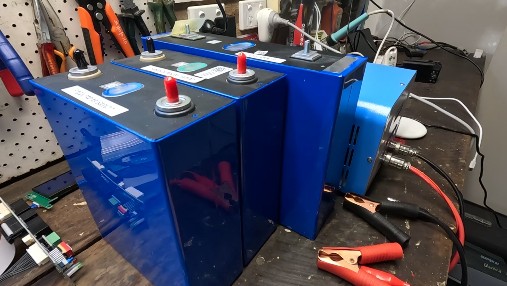
Fake (?) Hithium 280Ah, 10.000 cycles LiFePO4
Test1:
Full charge/discharge cycle
Charge:
2-5V-3.65V, 40A, 1A cut-off
Discharge:
3.65V-2.5V, 40A
Charge and discharge graphs (bmp)
Full charge and discharge curve (.csv file)
Download data
Review video here with explanation of charge and discharge curve
Yixiang EVE LF280K
A-Grade Cells
Consistency Check
Test1:
Charge cells from 2.5V-3.65V, CV 40A
Cut-off: 14A
Measure capacity, avg voltage and take charge curve
Discharge cells from 3.65V – 2.5V, CC 40A
Measure capacity, avg voltage and take discharge curve
Data and graphs from 4 random cells out of 16.
Comparison of charge and discharge consistency.
Comparison with Gobelpower cells
Download data (.csv and .bmp files)
Watch the test video here with all explanations.
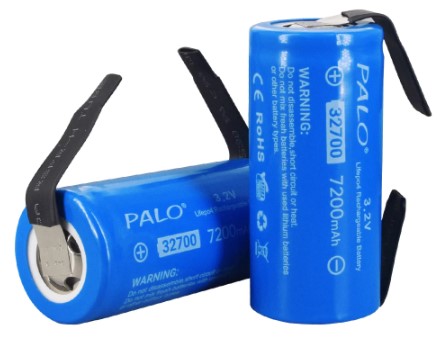
PALO LiFePO4 32700
-7200mAh
-5C discharging
-3A charging
Test 1:
Capacity test each cell
Charge and discharge with 0.2C from 2.5V to 3.65V.
Overlay all graphs to visualize the spread of capacity.
Charge/discharge graph (bmp)
Full charge and discharge curve data (.csv)
Download Data
Full Video review and capacity test
Test 2:
High current discharge test with 5C, 35Amps.
Measuring amps and temperature
Charge/discharge graph (bmp)
Full charge and discharge curve data (.csv)
Download Data
Full Video review and capacity test
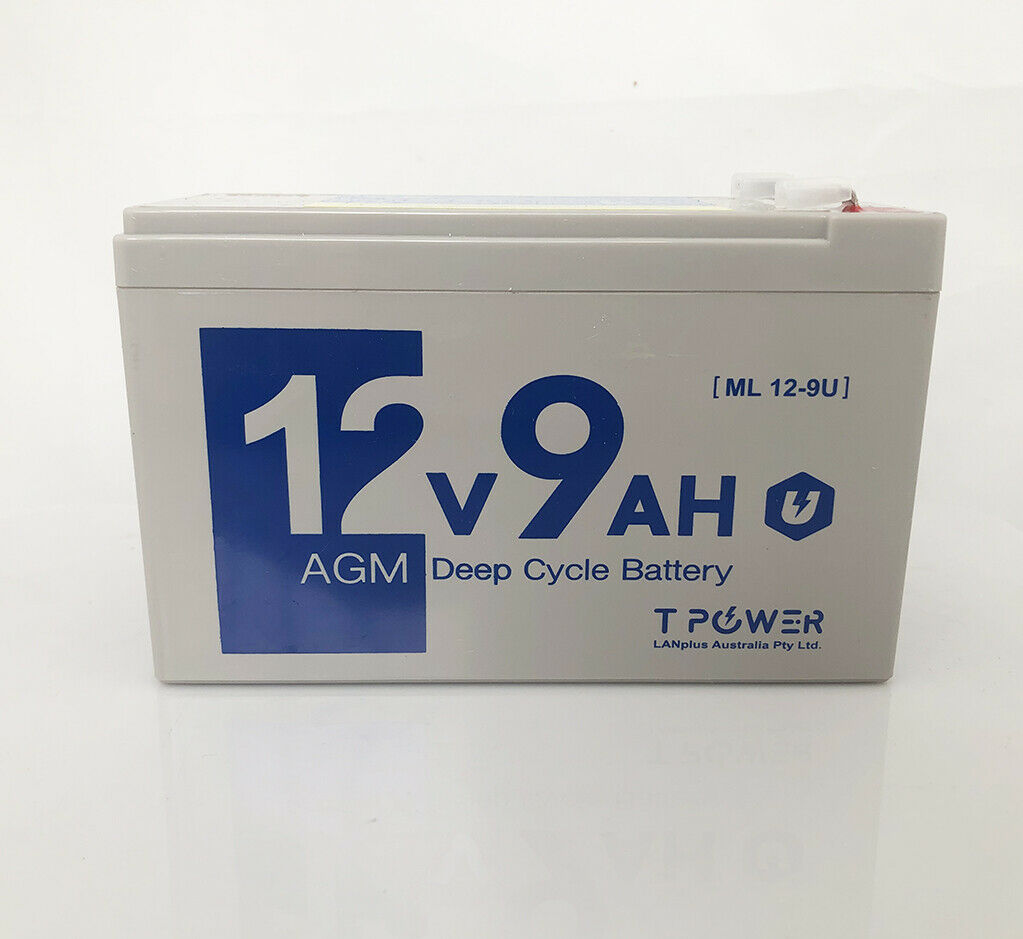
T-Power 12V/9Ah AGM Battery
Below are ebay affiliate links for which I may be compensated if you make a purchase. This does not make the product more expensive for you!
Test 1:
Full Charge/Discharge test
Discharge: 0.45A (0.05C) to 10.5V
Charge: 0.9A (0.1C) to 14.7V
Temperature: 17°C
Tester: ZKE-Tech EBC-A20
Charge and discharge graphs
Full charge and discharge curve data
Download Data (bmp and csv file)
Full video and analysis.
Test 2:
Full Charge/Discharge test
Discharge: 0.45A (0.05C) to 10.5V
Charge: 0.9A (0.1C) to 13.8V
Temperature: 17°C
Tester: ZKE-Tech EBC-A20
Charge and discharge graphs
Full charge and discharge curve data
Download Data (bmp and csv file)
Full video and analysis
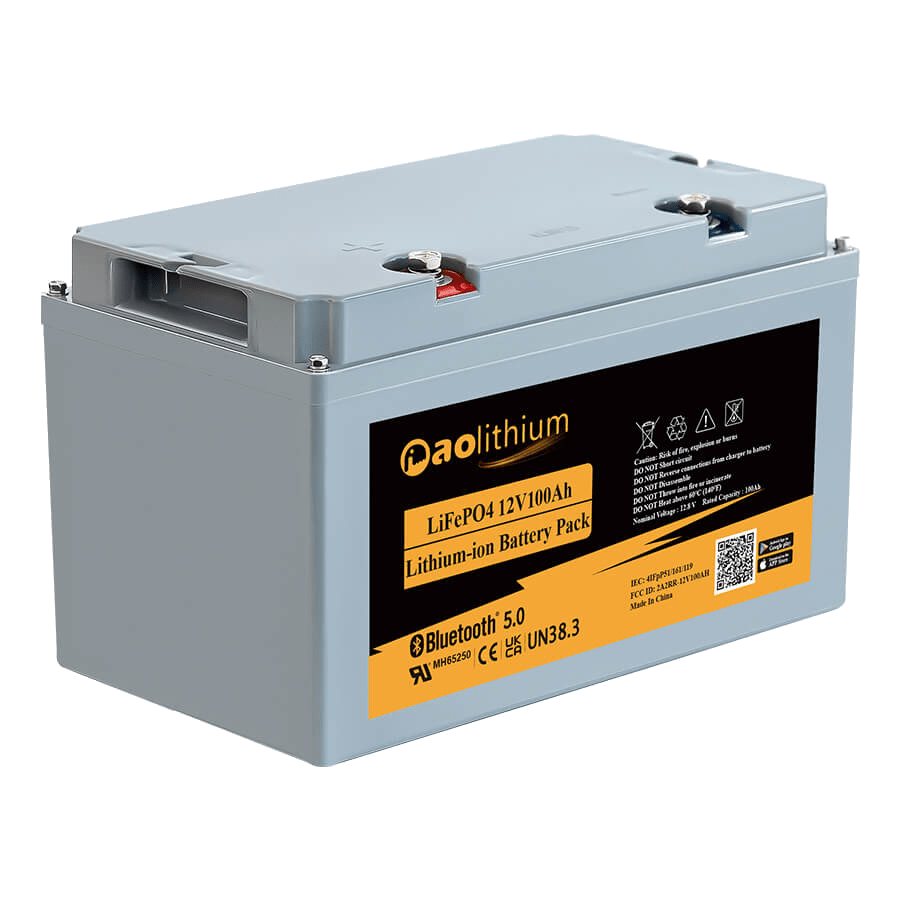
AoLithium 12V 100Ah LiFePO4 Battery
Test 1:
Test of all 4 individual cells.
Charge from 2.5V to 3.65V, 20A
Discharge from 3.65 to 2.5V, 20A
Charge and discharge graphs
Full charge and discharge curve data
Download Data (bmp and csv file)

Shenzen Basen 12V/100Ah Battery
Test1:
Fully discharge from 14.5V to 10V with 6.5A
Discharge graph
Download Data (bmp and csv file)
GeB 18650 Sodium Cells
18650, 1500mAh, 3.1V
Test1:
Fully discharge from 3.95V to 1.5V, 0.75A (0.5C), 25°C
Full charge from 1.5V to 3.95V, 0.75A 0.1A cut-off
Tester: ZKE-Tech EBC-A20
Charge and Discharge graphs and data.
Download Data (bmp and csv files)
Test2:
Fully charge to 3.95V with 0.1A cut-off.
Discharge to 1.5V with different currents.
Tester: ZKE-Tech EBC-A20
C-Rating test of sodium battery.
Discharging with
0.2C – 0.26A
0.5C – 0.75A
1C – 1.3A
3C – 3.9A
Download Data (bmp and csv files)
Test video here.
Test3:
Charge to specific voltage with 0.5C (0.65A).
Discharge to 1.5V with 0.5C (0.65A).
Tester: ZKE-Tech EBC-A20
Absorption test of sodium battery.
Charge to 2.0V, 2.1V, 2.2V, … 3.95V
discharge immediately when reaching this voltage and measure the capacity.
Charge to the same voltage again, CV charge until current is at 0.1A. Discharge and measure capacity again. Compare to first capacity measurement.
Download Data (bmp and csv files)
Google Spreadsheet with results and graph.
Test video here
Test4
Discharge cell from 3.95V to 0V with 0.65A
Tester: ZKE-Tech EBC-A20
DL24P Electronic Load
Discharge test of sodium battery to 0.0V
Fully charge and absorb the cell to 3.95V with 0.1A cut-off.
Discharge to 0.0V with 0.65A (0.5C).
Measure capacity and take discharge curve
Download Data (bmp and csv files)
Test video here
Test4.1
Discharge cell from 3.95V to 0V with 0.65A
Tester: ZKE-Tech EBC-A20
Discharge test of sodium battery to 0.0V
Fully charge and absorb the cell to 3.95V with 0.1A cut-off.
Discharge to 0.0V with 0.65A (0.5C).
Measure capacity and take discharge curve.
2nd test using the ZKE EBC-A20 tester and discovered another voltage plateau at 0.3V
Download Data (bmp and csv files)
Test video here
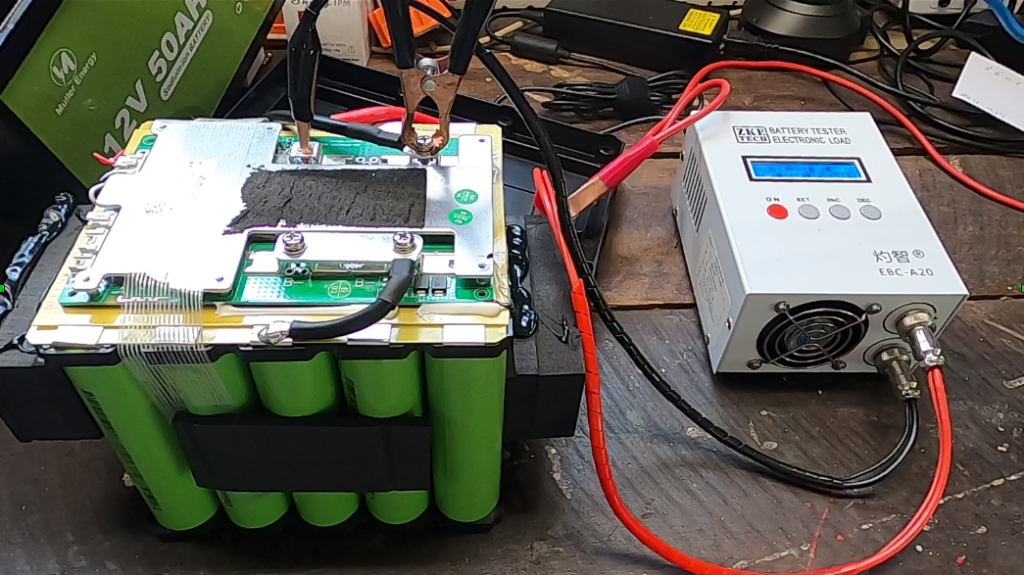
12V, 50AH Sodium Battery
Teardown and capacity test
Test1
Charge 0V-16V, 5A
Discharge 16V-0V, 5A
Tester: ZKE-Tech EBC-A20
Charge test of Sodium battery from 0V – 16V,
discharge test from 16V to 0.0V
Measure capacity and take charge/discharge curve.
Download Data (bmp and csv files)
Voltage-SOC Spreadsheet
Test video here
All product links on this page are affiliate links to support the channel. I’m getting paid a small commission if you order products or services through these links. This does not make the products or services more expensive for you.
